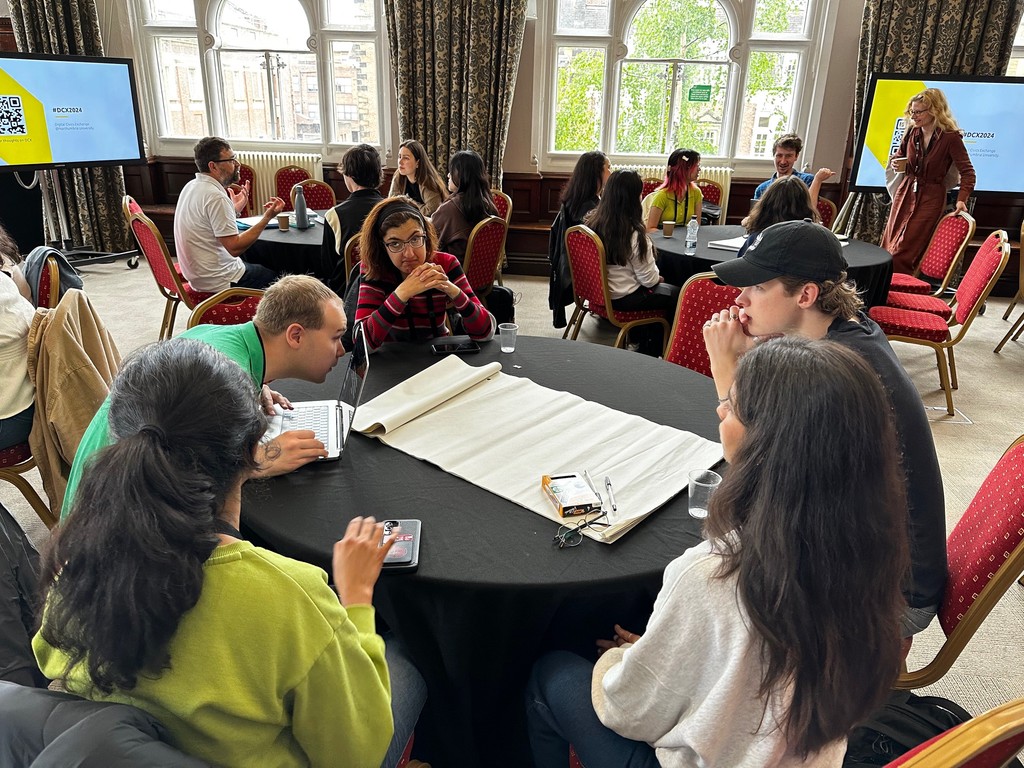
May 2024 - Digital Civics Exchange Design Challenge - Northumbria University
Accessibility: Making It a Priority, Not an Afterthought
Orginating from Newcastle, a dainty little town in northeastern england, this project focuses on making Fully Autonomous Vehicles (FAVs) accessible for Visually Impaired People (VIPs). Our goal was to craft tangible data capture methods to identify 'pain points' in VIPs' current journey experiences. The insights generated through this project will inform the design of an accessible control system for FAVs, potentially improving VIPs' quality of life. The research also aims to enhance accessibility in human-centered design methods for visually impaired researchers.
What did I do?
Led research efforts, defining the research intent, identifying key focus areas, and planning data capture methods to study visually impaired users' experiences in autonomous vehicles. Conducted user observations and analysis, contributing to the design of a prototype device that captured real-world accessibility challenges.
Duration
2 weeks
Here are some numbers to get you interested
About 2 Million people in the UK suffer from vision loss with about 340,000 people being registered blind or low vision. This number is expected to double by 2050. [1][2]
If that doesn't get you interested in this effort here are some more numbers from a recent study.
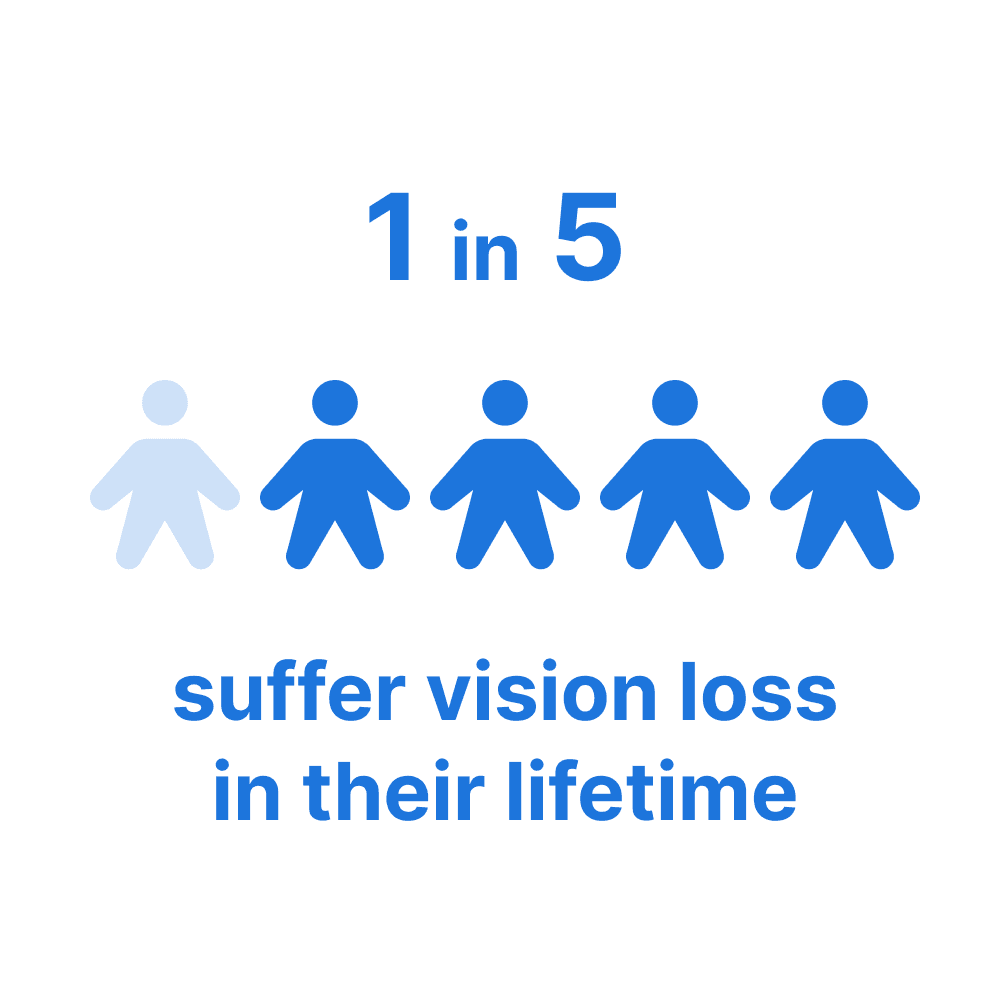
1 in 5 people will live with sight loss in their lifetime
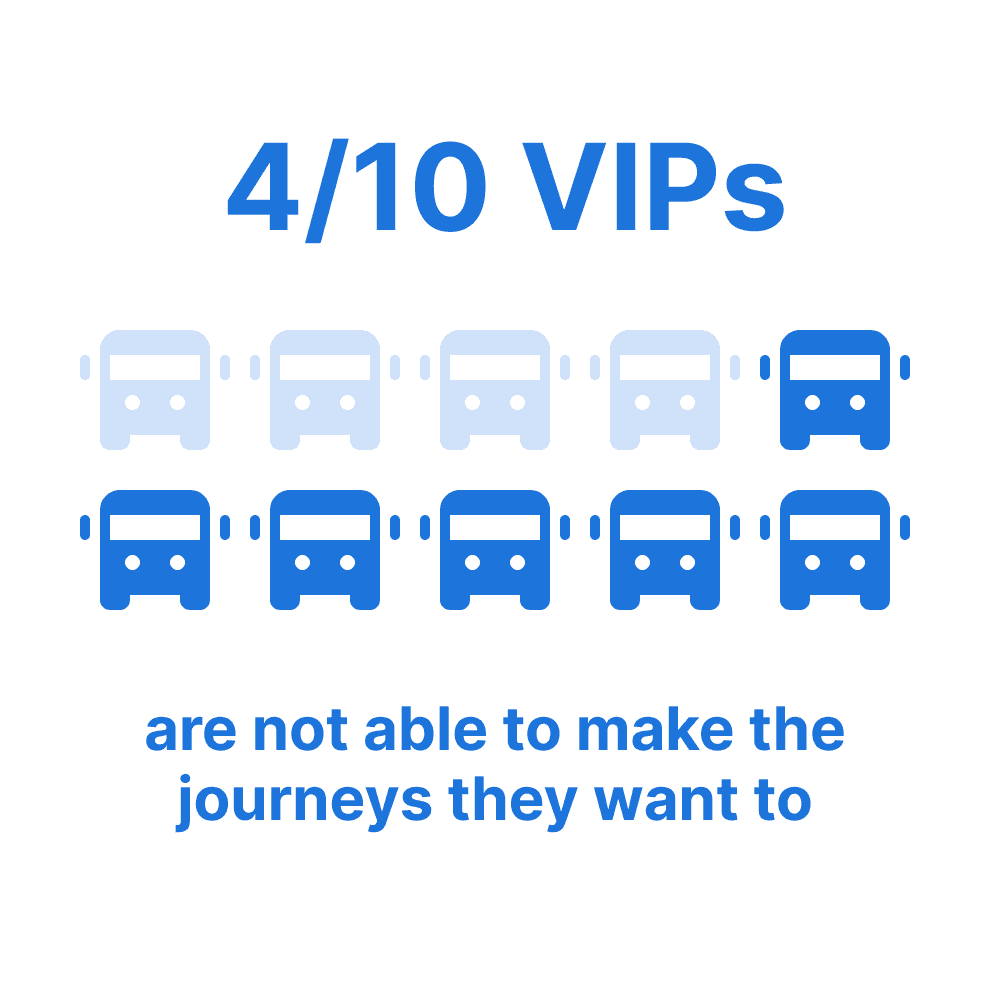
4 out of every 10 blind and partially sighted people were not able to make all the journeys that they want or need to make
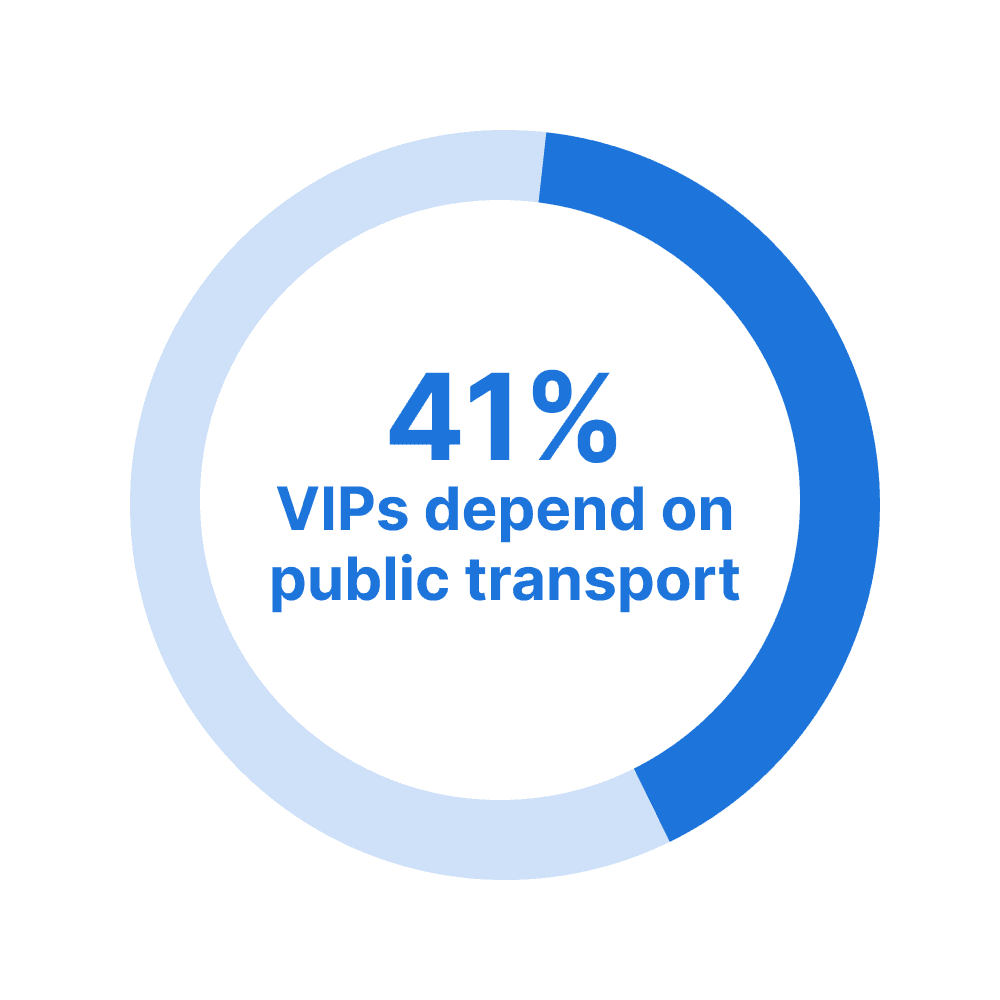
41% participants in a recent survey depend on public transport for their day-to-day activities.
But there is also a willingness among blind people to try FAVs! So yay!
I got to visit Northeastern England, specifically the city of Newcastle, to work on this project on digital civics with a local researcher(shout out to the super cool Peter Hayton) and within a local context. Peter is a PhD student whose research focuses on designing and developing interfaces for FAVs in a VIP-friendly manner from the beginning, rather than as an afterthought.
Interesting facts about the North-eastern England (trust me this is relevant)
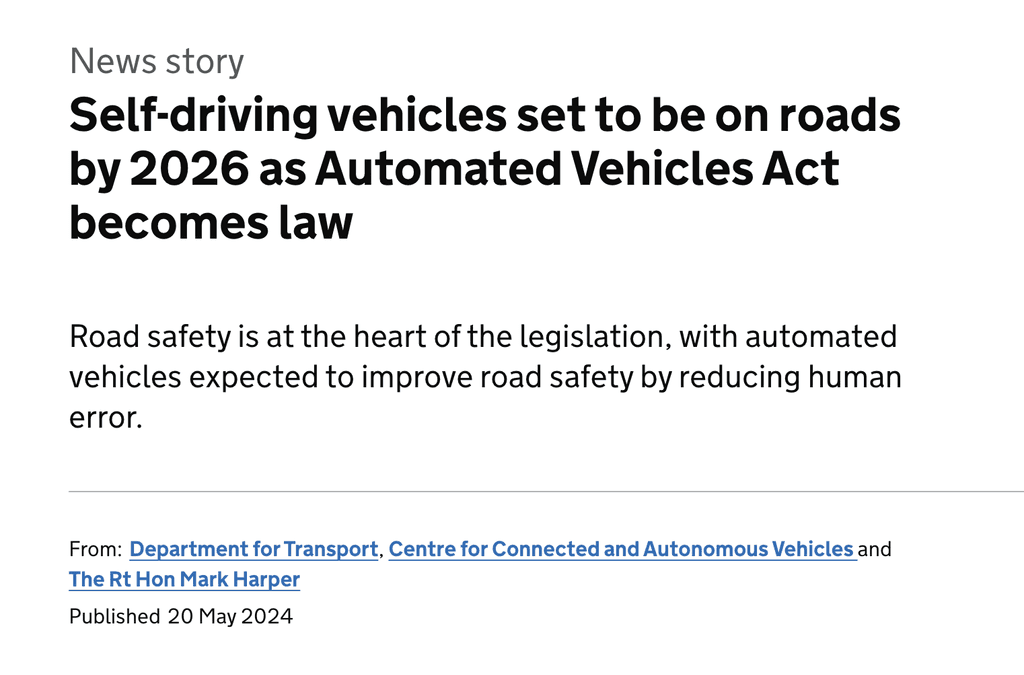
The Autonomous Vehicle act was passed making FAVs on roads a reality by 2026 (this happened while we were working on the project, exciting stuff!)
The availability of a well-connected, pocket-friendly public transport system, ranging from buses to ferries, encourages locals to use them more.
Accessibility is taken seriously!
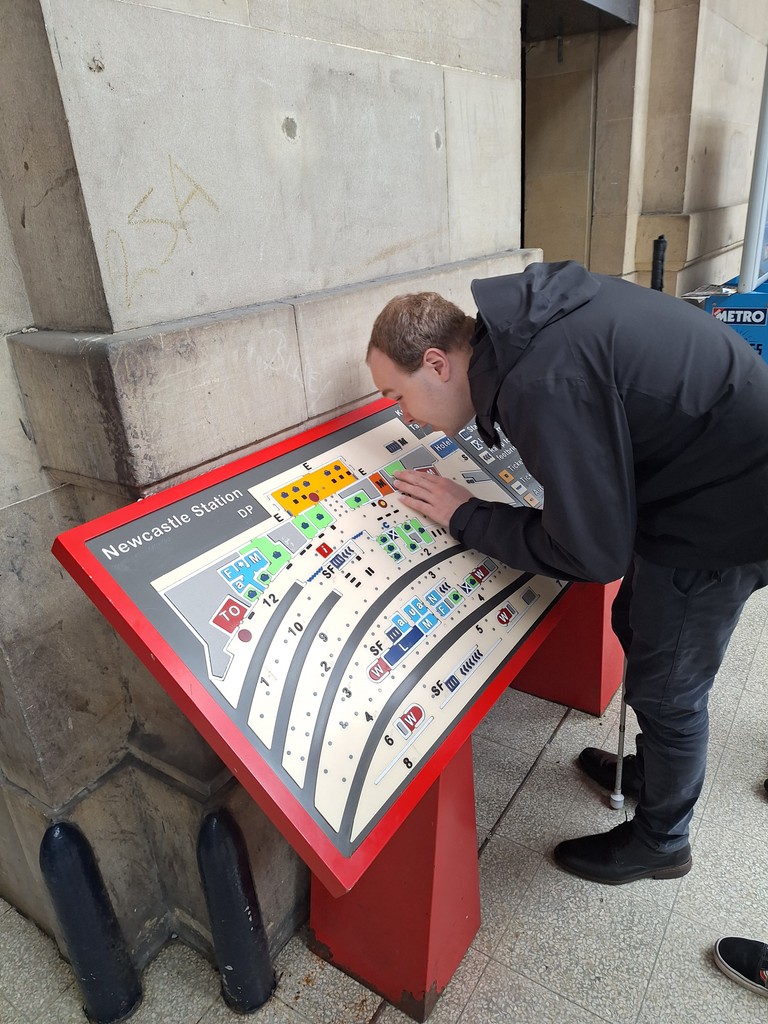
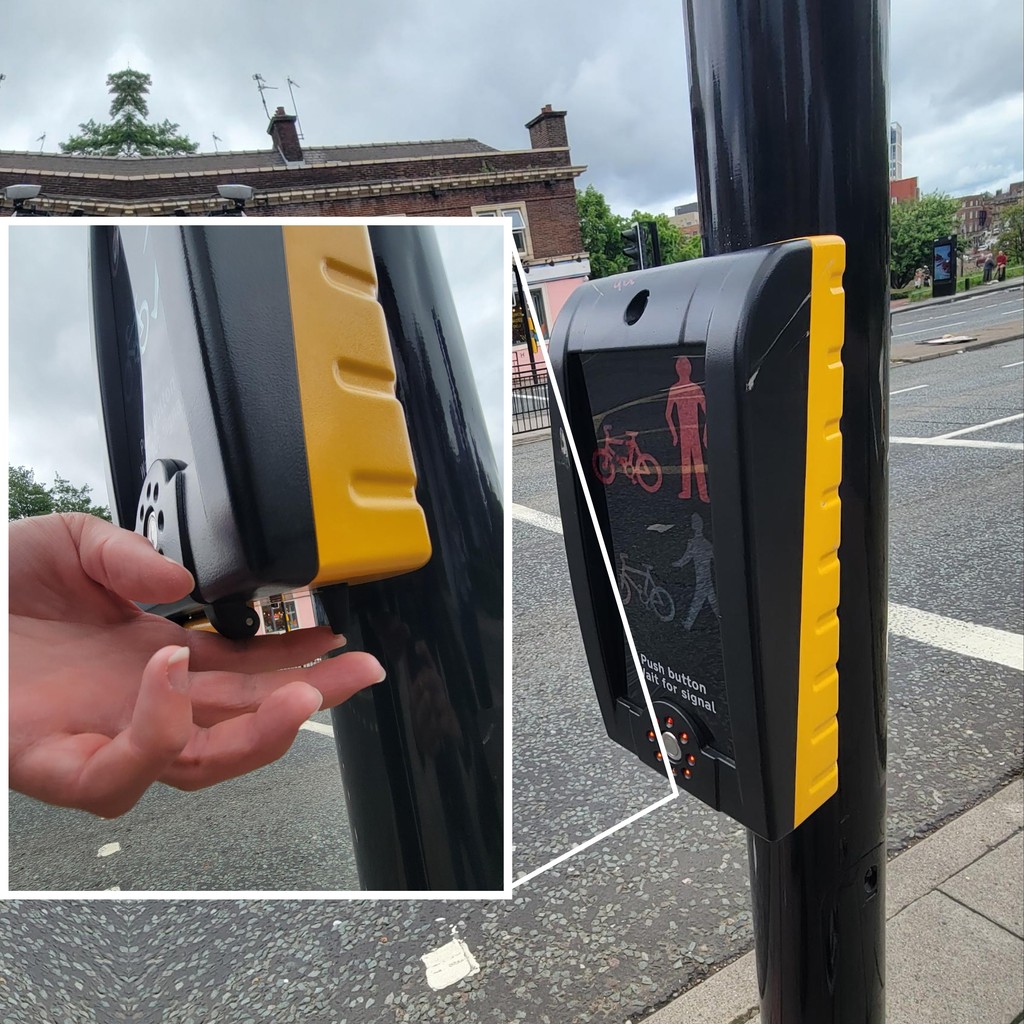
One might find tactile designs- from maps to flooring all around UK designed for accessibility. The Rotating cone under the crosswalk signal also known as the Secret Button was a truly an inspiring design!
A tactile map of the train Stations placed by LNER
The Secret Button aka the rotating cone
Northeastern englanders love their autonomy. This was an observation I made but turns out there are some historic and political reasons to it.
Okay so now that you have some context,
How do you evaluate the experience of a visually impaired person traveling in a fully autonomous vehicle, in the UK?
How do you capture data for this evaluation?
Data Capture Methods
All the data capture methods we developed use a cane with sensors attached to it, either directly or indirectly, to aid the output.
To understand this better, let's look at how a cane works.
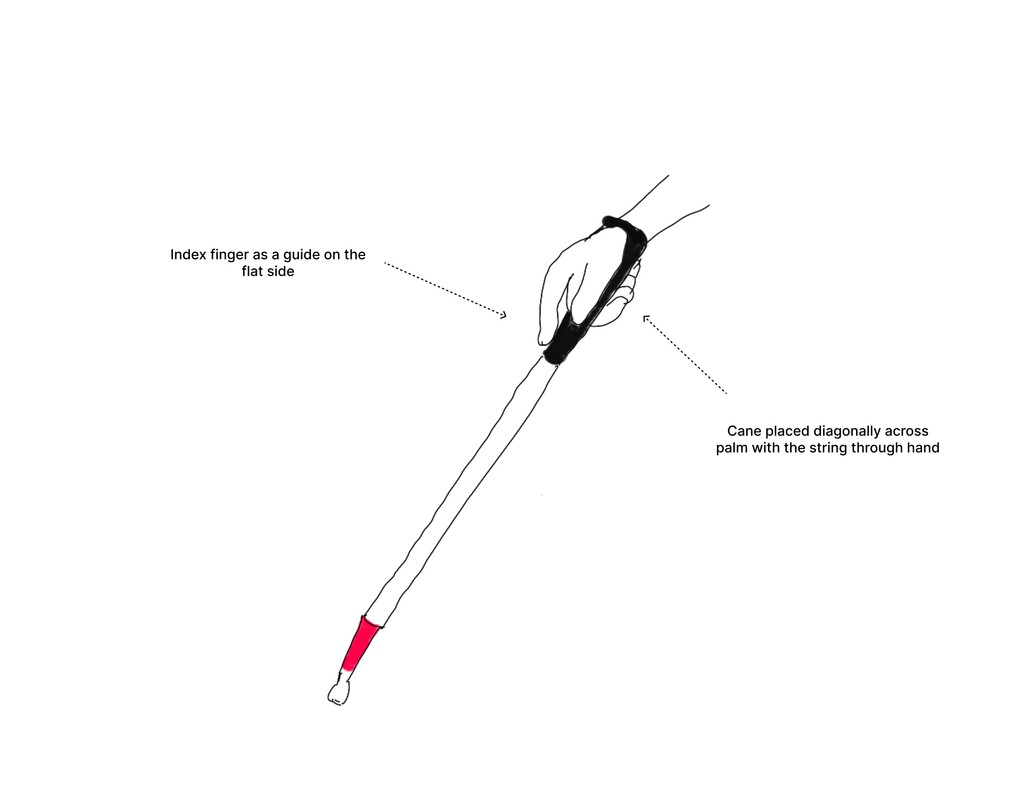
There are different types of canes, with the white cane being widely used by VIPs. Variations within the white cane itself exist. For example, an all-white cane indicates that the person is completely blind, while a white cane with a red bottom might indicate partial vision impairment.
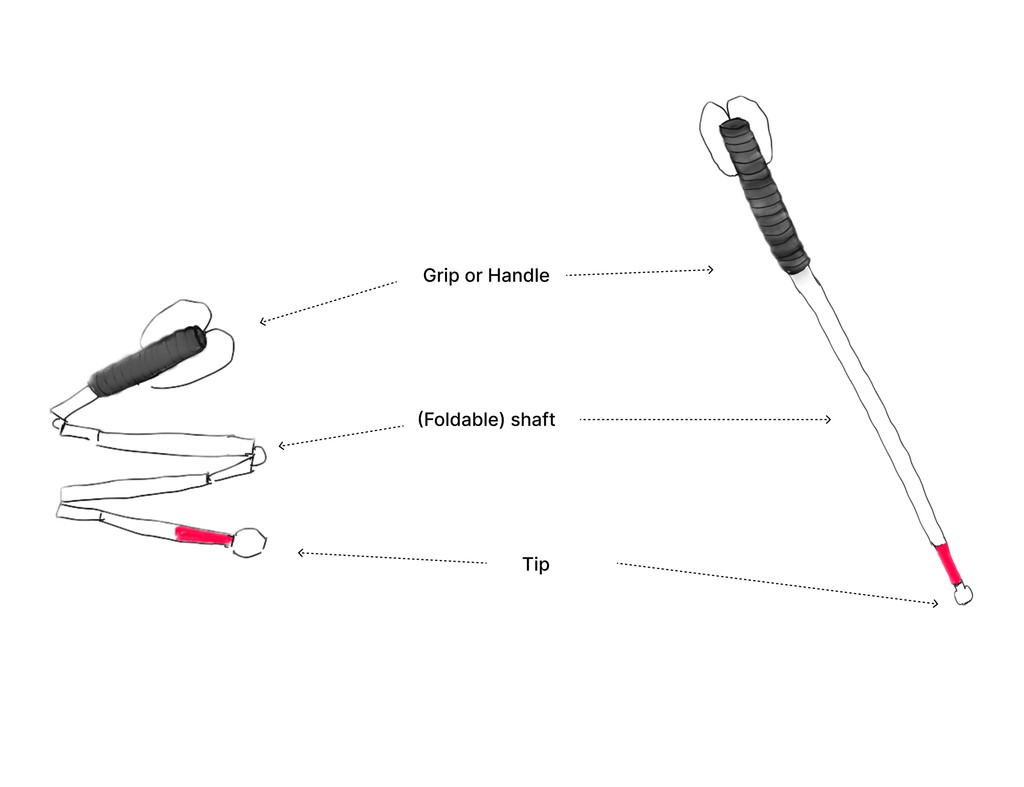
There are also variations in the different parts of the cane. A cane has three main parts:
The Grip or Handle: Usually textured and has a flat section to help with guiding.
The Shaft: The long part, customized to the person's height, which can be folded if it’s a foldable cane.
The Tip: Used to scan for and find obstacles. Different tips offer various benefits in terms of reaction time and echoes.
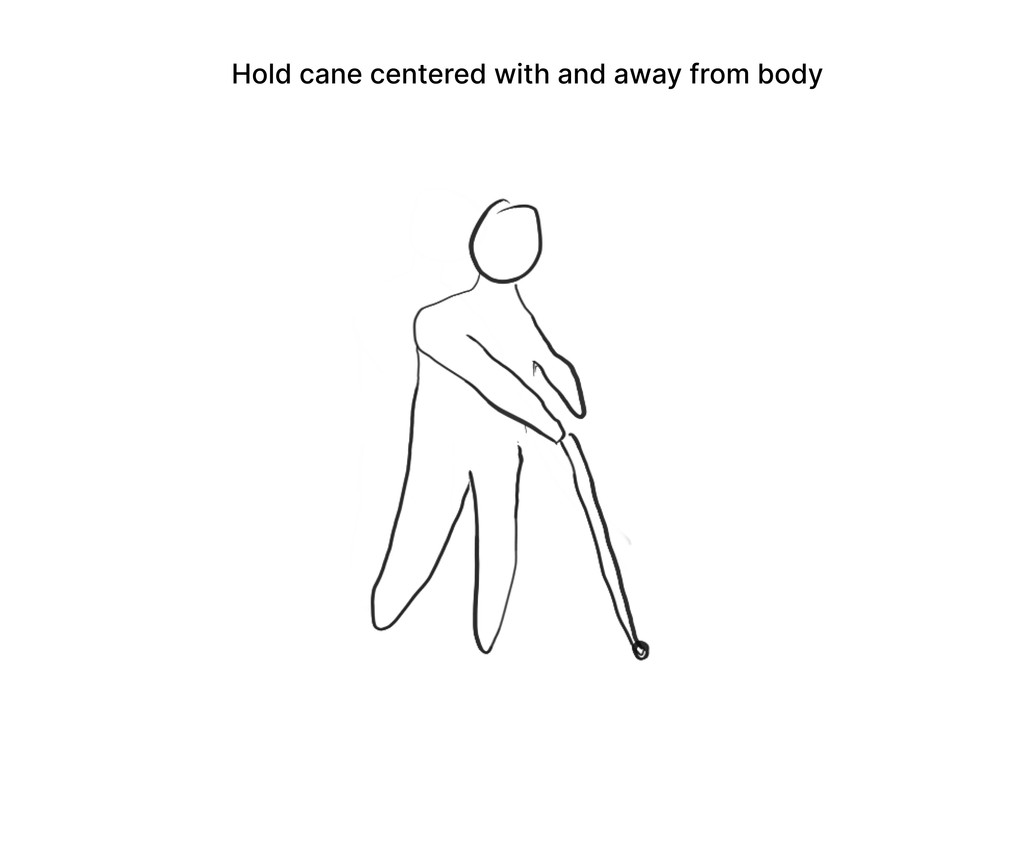
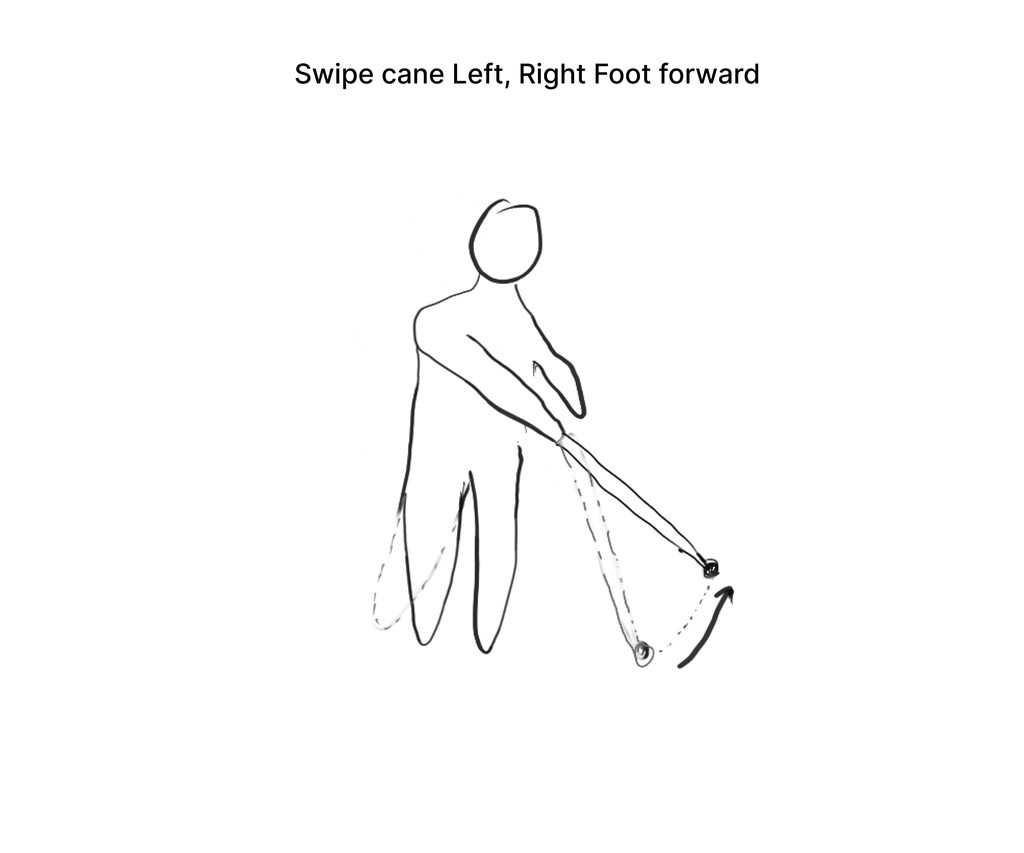
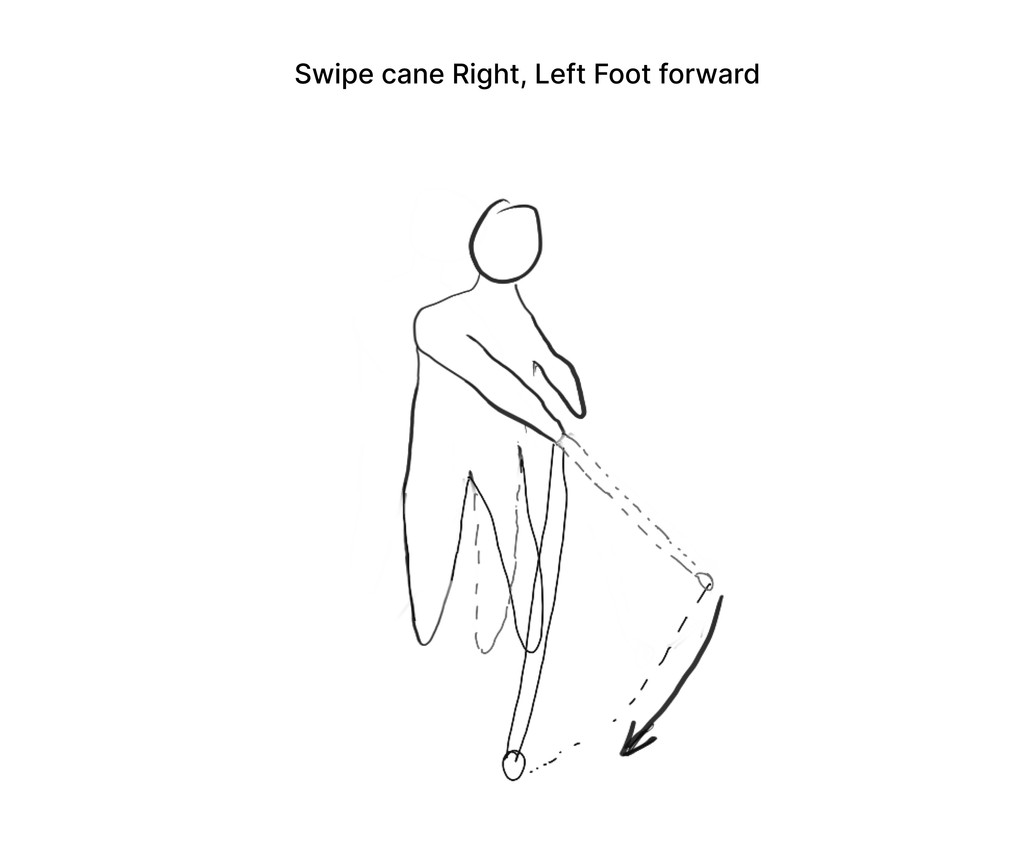
Now let's understand how the white cane is generally used. While walking, the cane is used for probing or scanning for obstacles. A sweeping motion is used to cover the maximum area. The cane is always one step ahead, scanning for what’s next. So the cane and the leg are in opposition - swipe right, take your left foot forward, and vice versa.
If an obstacle is encountered, the user decides the next course of action based on the echo and texture.
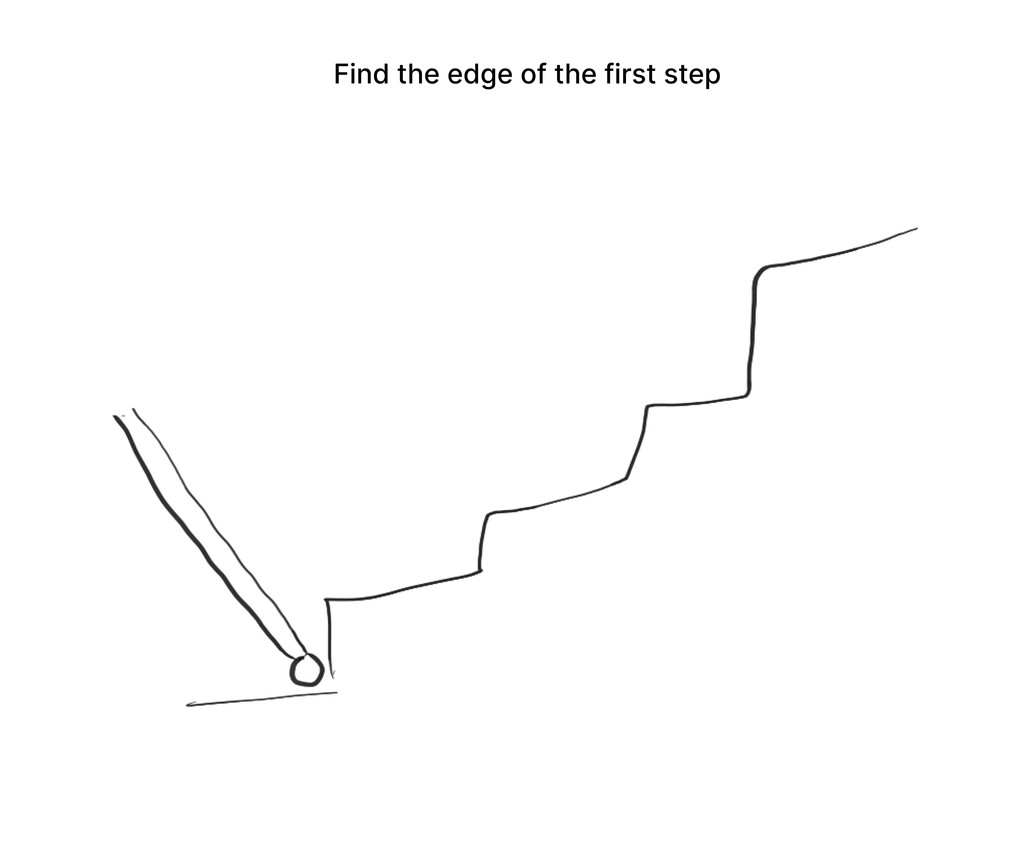
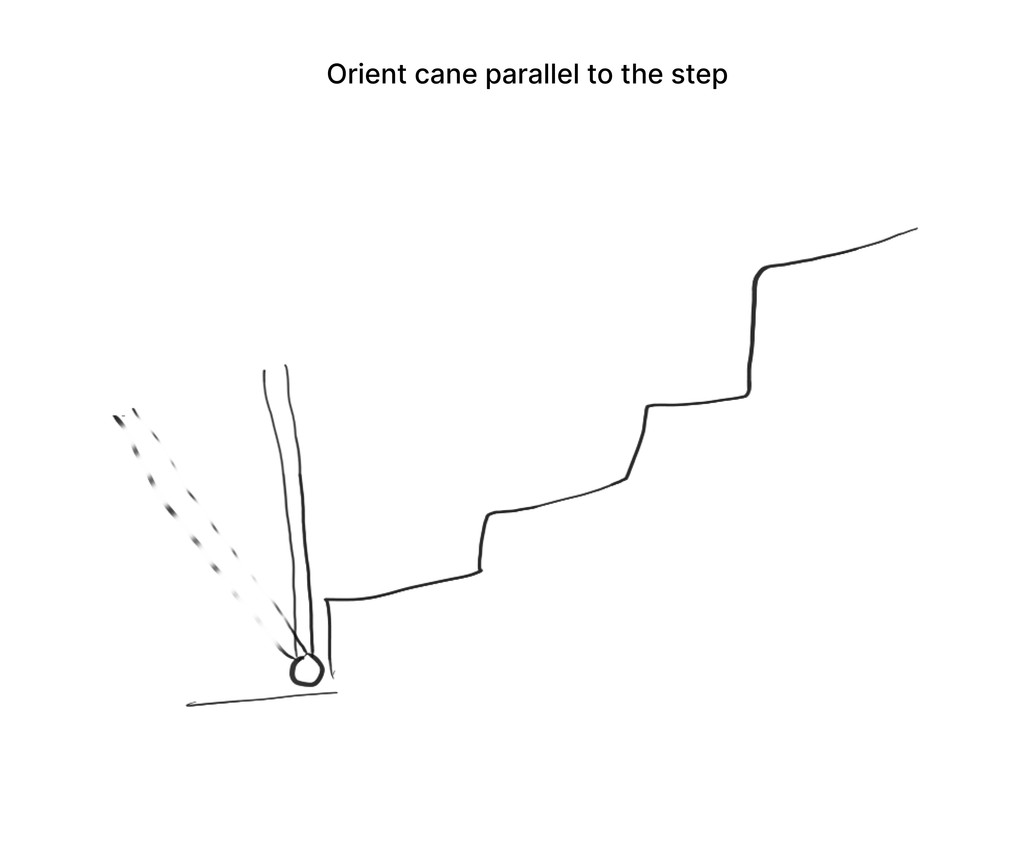
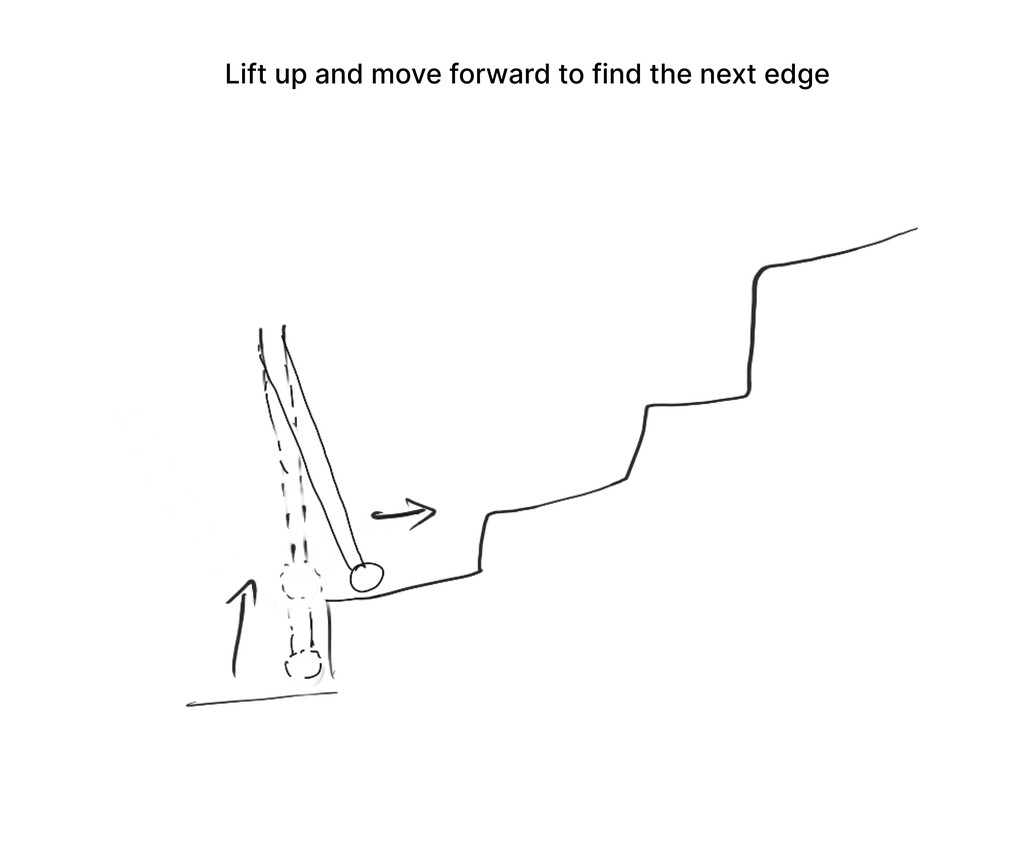
Let's say the obstacle is a staircase, then a specific technique is used to tackle it.
This is just one of many techniques they use. Crossing an intersection or a crosswalk presents a whole new set of challenges.
If you’re thinking, “Woah, that’s a lot,” you’re right, it is. A typical journey using public transport involves several of these techniques. Imagine the amount of mental overload that gets added on while taking a completely new route. So, it’s essential to focus on cane patterns, points of stress, and potential points of mental overload.
Sensors are a brilliant way to capture different kinds of data without adding additional stress on the VIP.
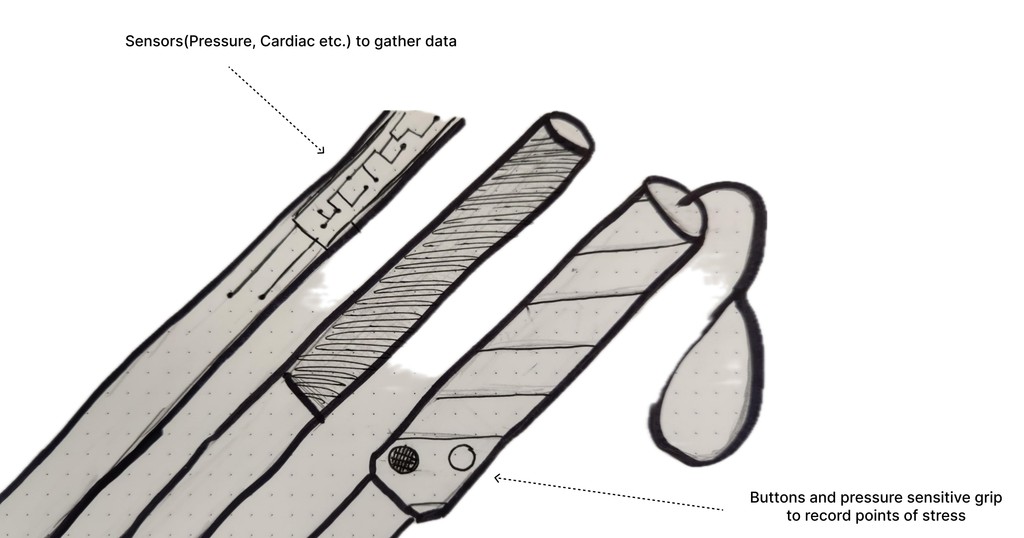
The grip of the cane can hold sensors and buttons to track data.
Buttons: For VIPs to manually track points of confusion or stress, which could be used as a tool for debriefing interviews.
Cardiac Sensors: To track changes and map them to points of stress.
Pressure Sensors: The grip can be made from a pressure-sensitive material.
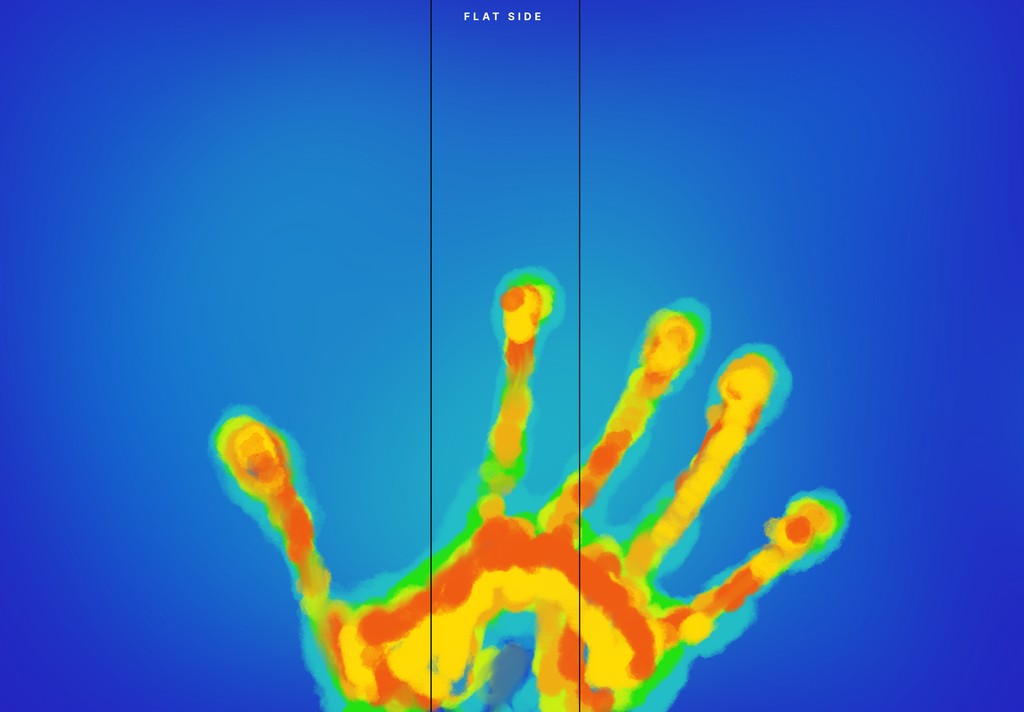
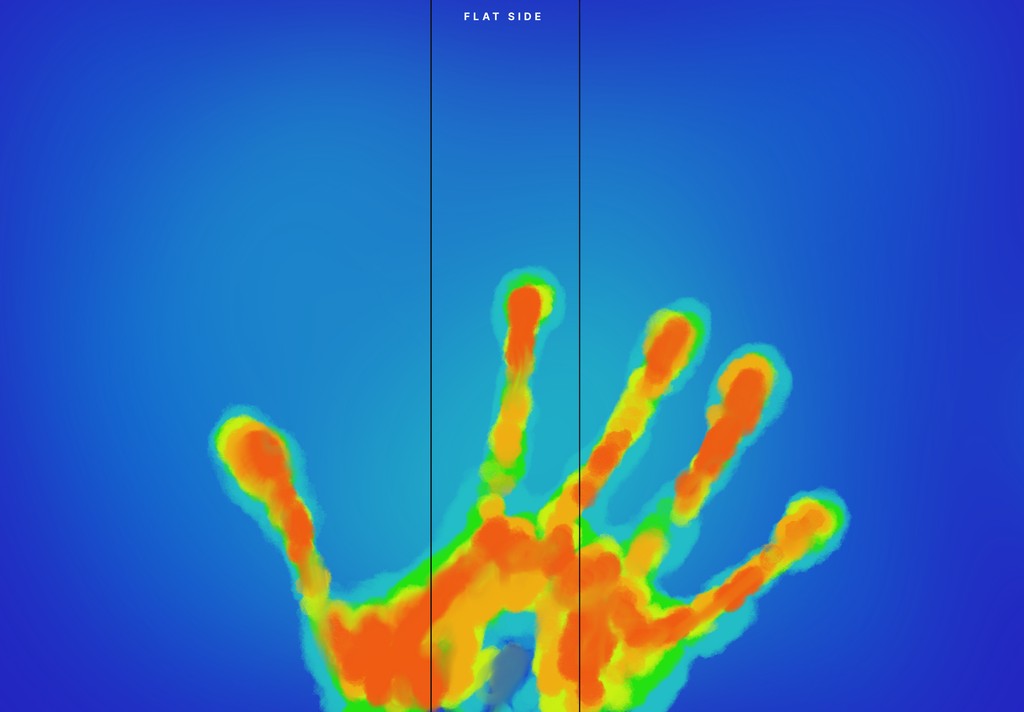
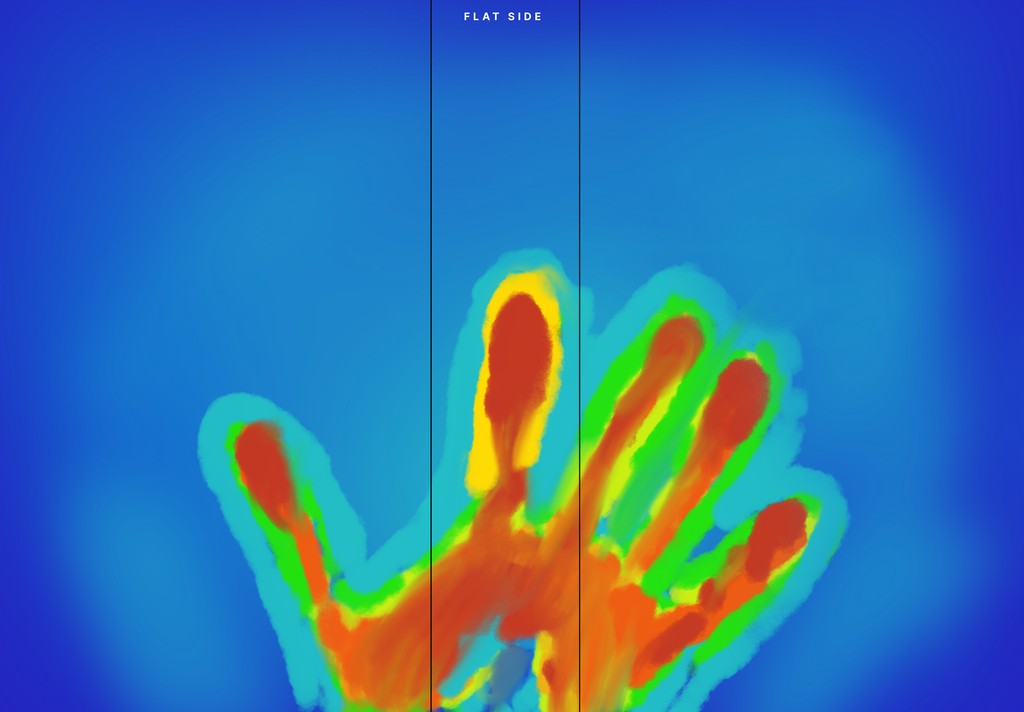
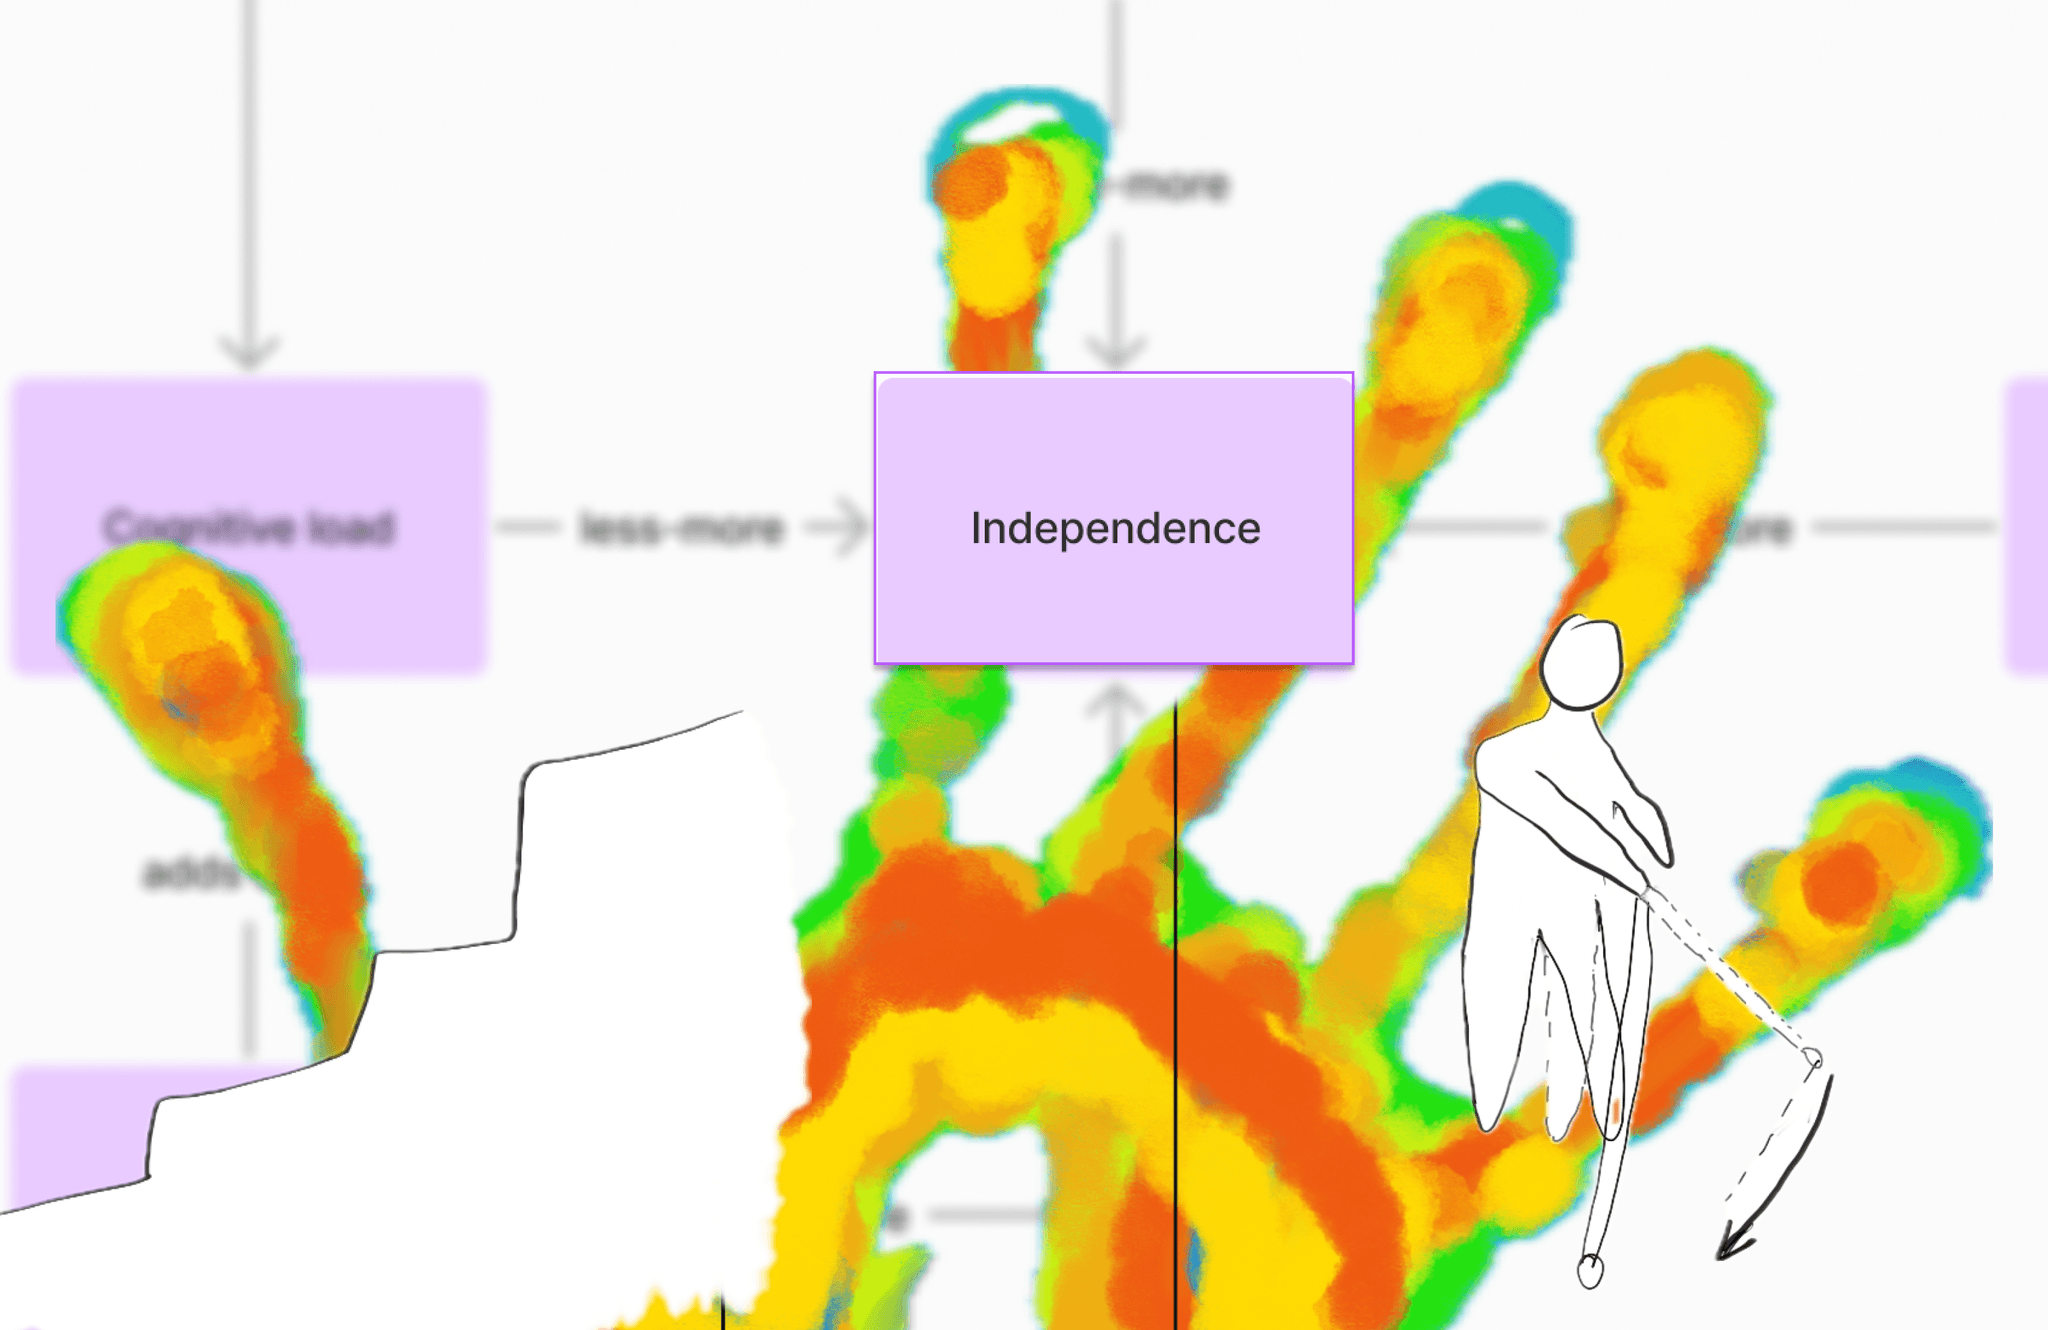
One way to track changes is by using Heat map data. A grip's cylindrical surface can be plotted into a rectangle and mapped, taking into consideration the flat surface and the index finger position. It is common for people to grip objects more tightly when something unexpected happens. Heat map tracking can be used with that logic in mind.
Here's an idea of the how the heatmaps might look. Guess which ones represent points of stress?
Other data capture methods that can either support the data collected by sensors or use the sensor data as probes themselves to collect more qualitative data.
Journey Mapping
Compare journeys of able bodied person vs journeys of VIPs (unique paint points)
Compare different public transport systems ( consistency)
Preliminary and debriefing interviews (identify perceived assistance vs actual assistance)
Integration into existing mobile navigation applications used by VIPs
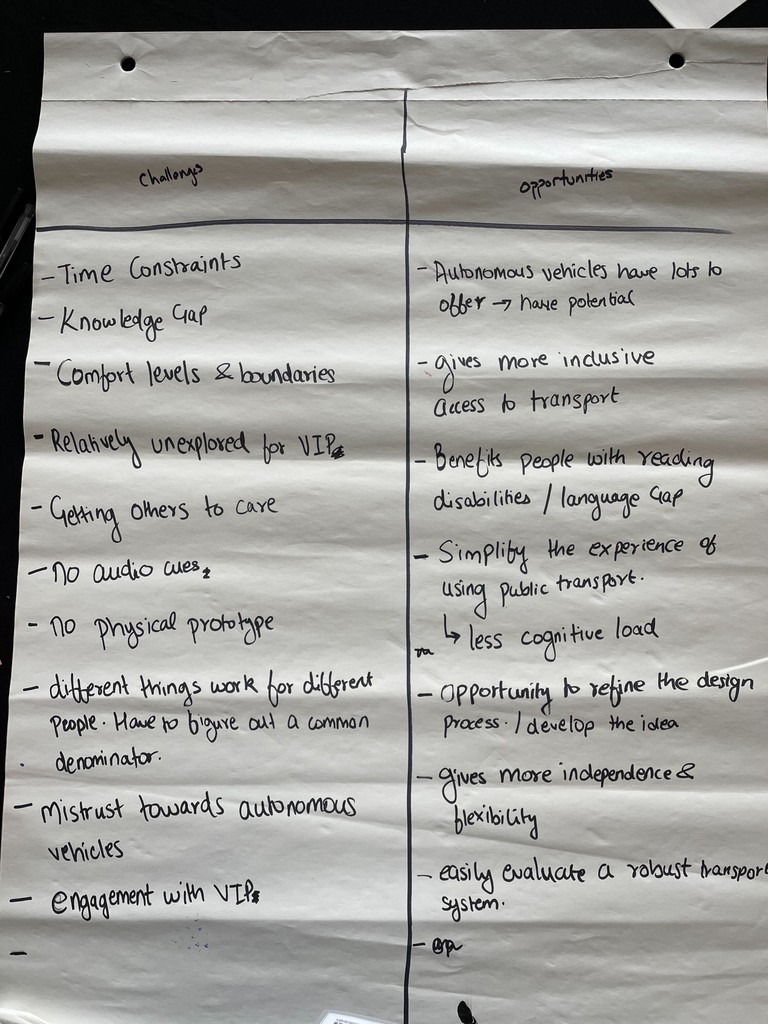
Challenges
With no access to Fully Autonomous Vehicles and not having been on one, we had to rely on previous research and other reliable sources on the internet to know more about how the experience might be, the potential yayys and nay's.
We were asked to think of methods that didn't involve recording of Video and Audio in a public space, as it obtaining proper permissions for it might be tricky.
Fragmentation, Inconsistency, Privatization of public transport system in the UK
Limited time - 2 weeks
Yes, these were some concerning challenges, but we tried to make the best of it by modifying our problem statement and scope.
How do you evaluate the experience of a visually impaired person traveling in public transport independently in a fully autonomous vehicle, in the UK?
How do you capture data for this evaluation?
This is still a very relevant problem and can be extended to FAVs used for public transport. In fact, it is even more important to focus on maintaining a consistent travel experience while designing an FAV for public transport.
So, how did we get there?
Learn about the problem space and our sponsor's lived experience surrounding the same. Understand more about the context and existing research
Chat with our in-house Expert
This was our intro into this realm altogether. So it was more of an inpromptu relay of questions from the team to our sponsor.
Desk Research
The stats presented in the beginning were from these. The 4 of us in our team took a look at existing research with different lens: practical, economic, design first, business first.
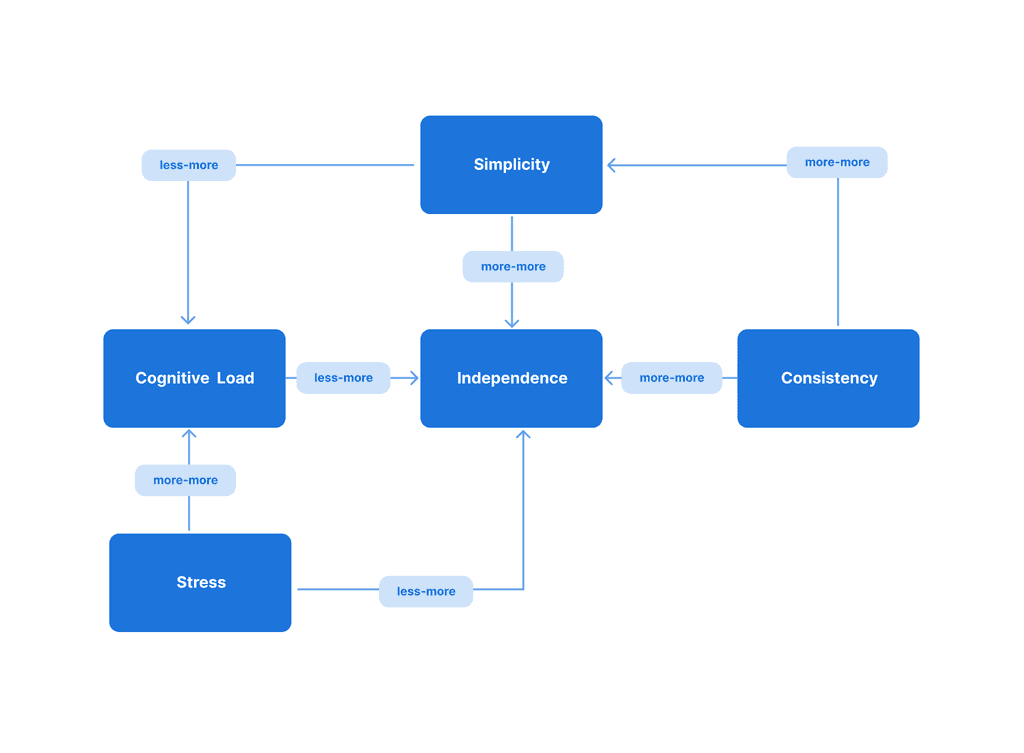
Identifying key contributing Factors
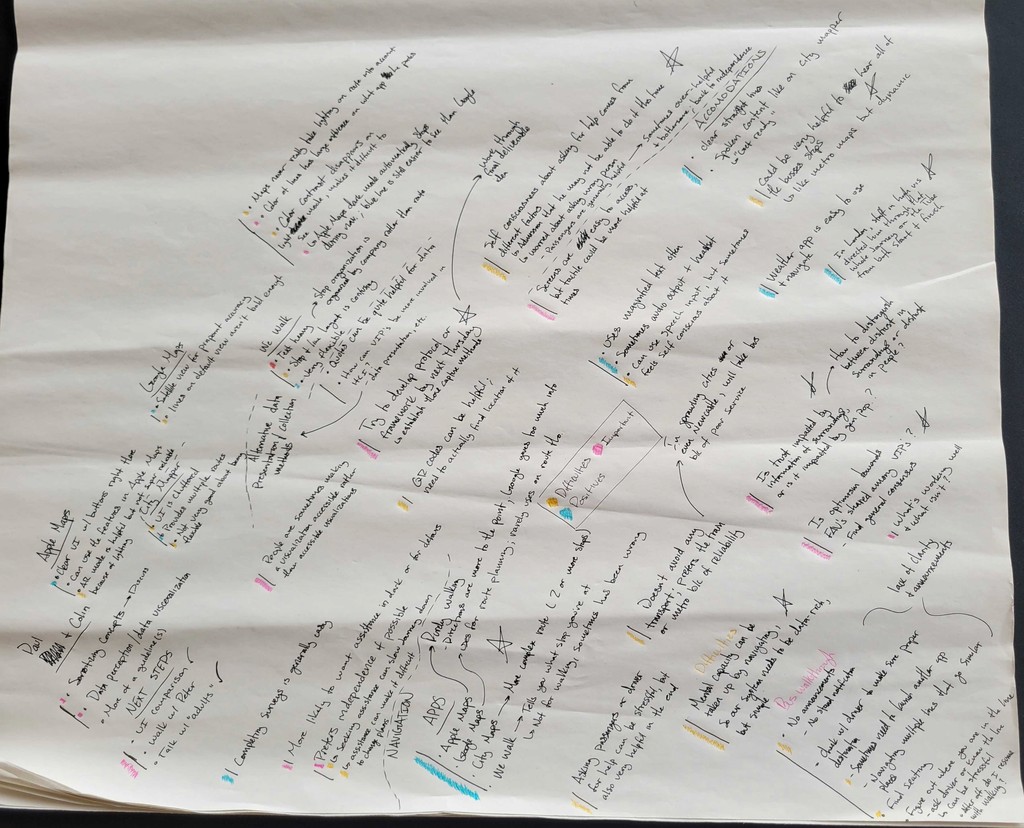
Using the context knowledge we obtained, we identified important factors and identified the relationships between each other.
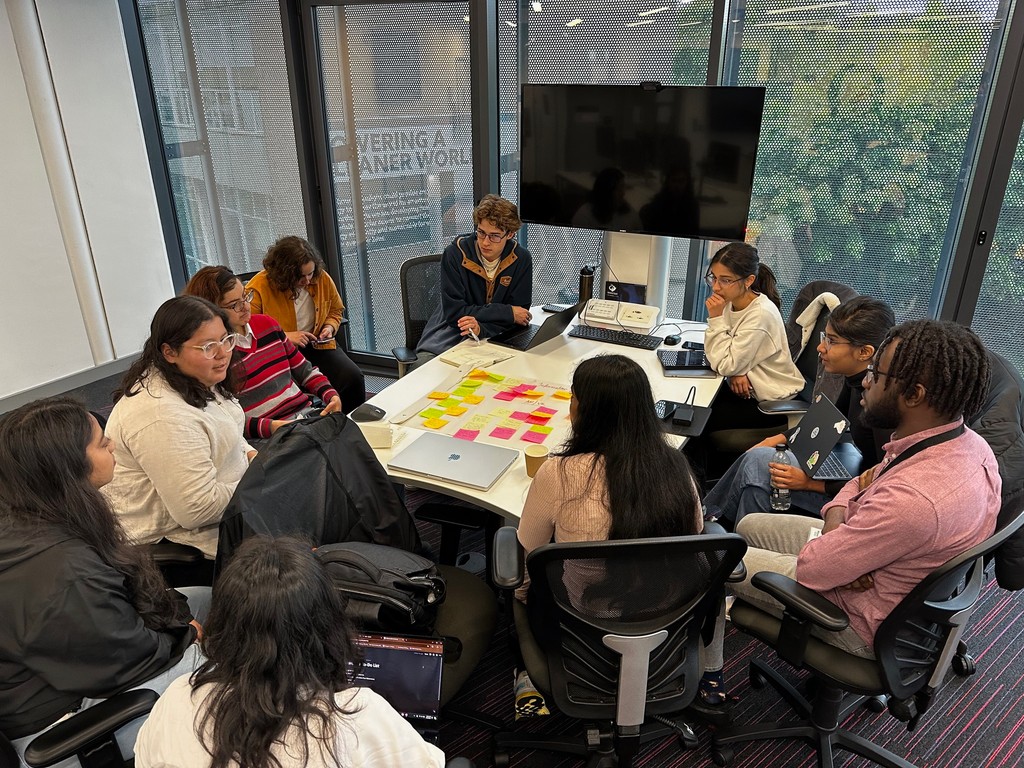
Brainstorming
Clearly independence is central to the problem and solution.
Keeping these factors in mind, we brainstormed several methods both existing and unique.
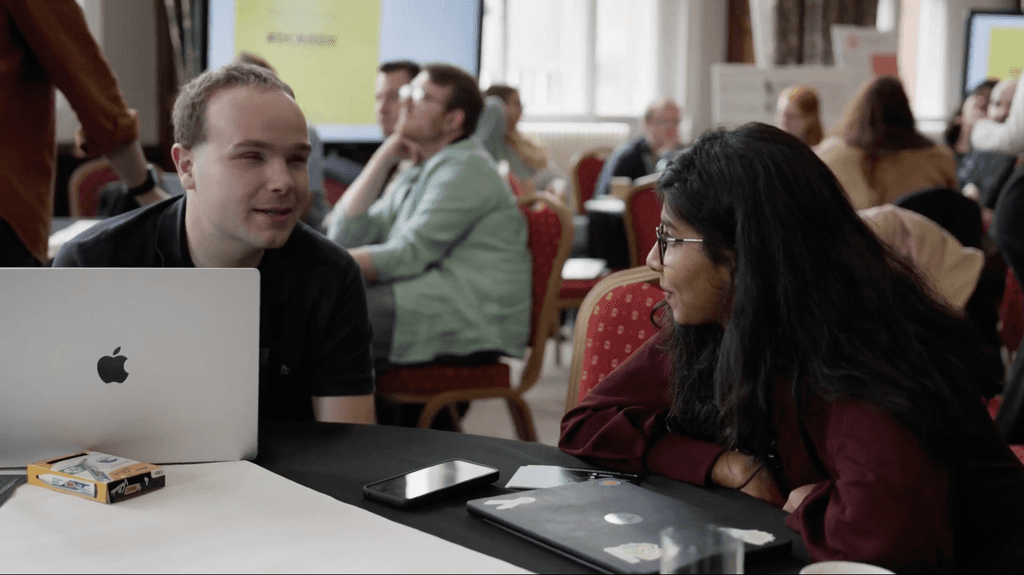
We also got to exchange ideas and feedback with other teams working on a different problem space.
Field Study
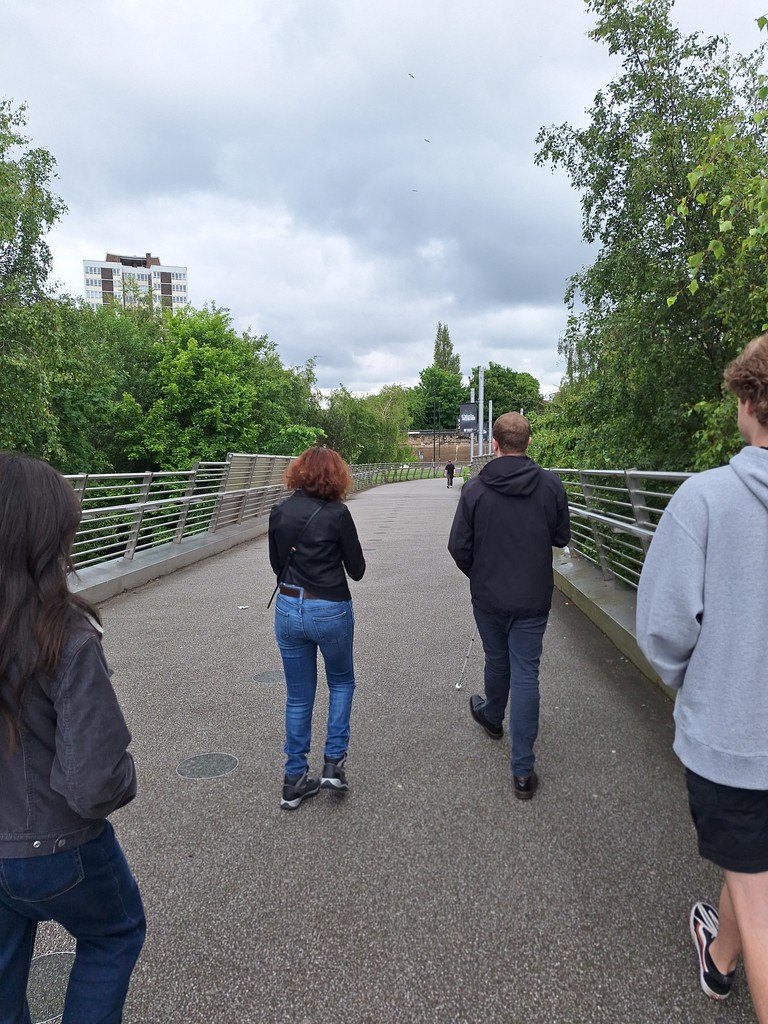
With the list of ideas, we ventured on a journey to observe Peter going on a route he has never been on before. We observed him trying to find the route to a bus stop, take the bus, find the metro station, take the metro and walk back to the starting place.
We asked questions at every break point to clarify any doubts we had on decisions he made along the way. We also evaluated the ideas we had, taking notes of what would work, what might not and things that could affect the outcome.
Back at the studio, we fine tuned the methods and ran it by our Sponsor, Peter to verify feasibility with respect to his research and beyond.
What I learnt (apart from everything I've just laid out)

Context is Key!
The entire project as all about very specific context! Northeastern England, VIPs, FAVs etc. Each one bringing in a unique perspective into the problem space.

Accessibility first
Designing for accessibility from the start, rather than as an afterthought, leads to better solutions

Making lemonade out of lemons
I learnt that challenges don't necessarily have to be obstacles. They can easily be turned fruitful if we take a step back and think out of the box.
